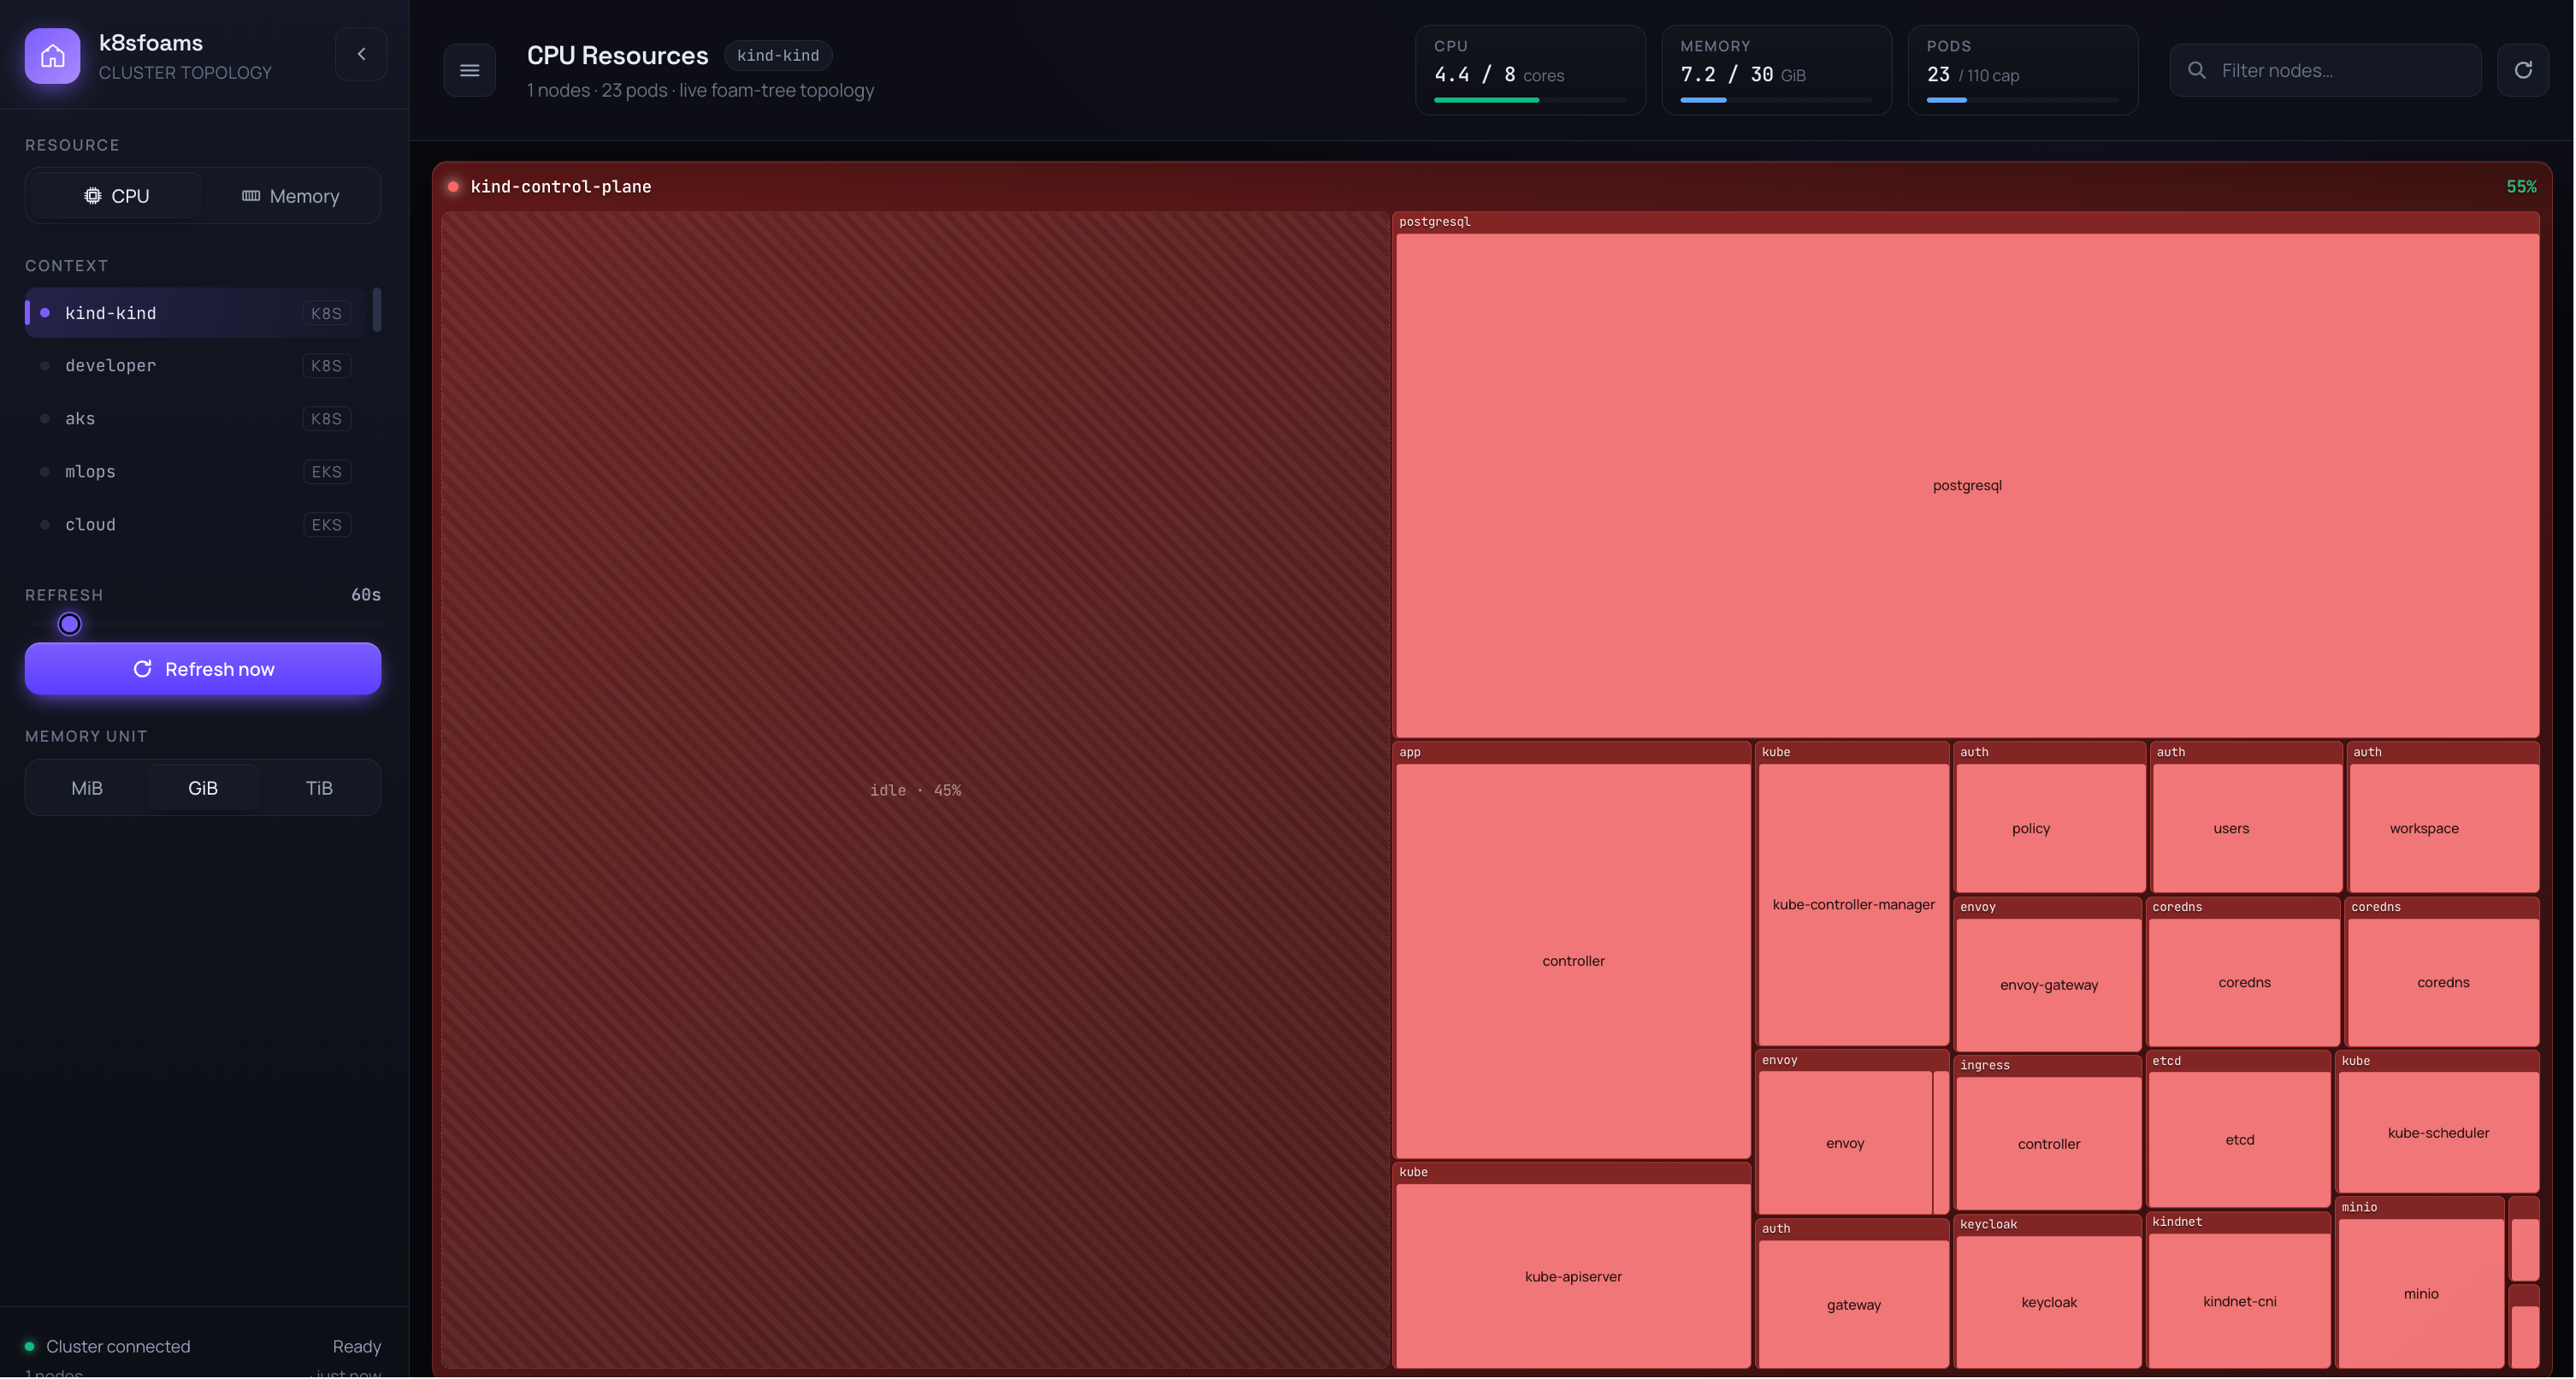
2D map
A squarified treemap. Each node is a box, each pod is a foam inside it, sized by its request. A pod with more than one container is split into sub-foams. The striped idle foam is unused (free) capacity on that node. Pick CPU or Memory with the Resource control, or an extended resource when the cluster has one.
Things to try in the embedded map:
- Hover a pod to see its namespace, requests, QoS class and any audit findings.
- Click a pod to pin its workload: every replica of the same Deployment or StatefulSet glows across the cluster,
and the header shows how many replicas run on how many nodes.
Escclears it. - Click a node header to open its focus overlay: every pod with CPU and memory, the container breakdown, the node's taints and conditions, and the Simulate drain button.
- Switch to Memory in the sidebar (the ☰ button opens it) and watch the same pods resize.
The number in each node header is its utilisation of the selected resource, colour-coded blue, green, amber and red as the node fills up.